Profiling code with 'perf'
This is an incomplete summary of the steps needed to profile C++ programs using Linux's perf tool, a fantastic profiler that samples your program and sees how much time is spent on each function, together with information about who calls whom.
First of all ensure that you have perf installed (in Fedora it comes with linux-tools), graphviz and also a recent copy of gprof2dot, which you can download here. Once these tools are ok, you can more or less cut&past and adapt the following commands.
Invoke the profiler on your program, instructing it to record information about which function calls which one (the call-graph)
# perf --call-graph dwarf your-program program-arguments
Data is stored in a binary file called perf.data. You can process it in text mode with
# perf report -g
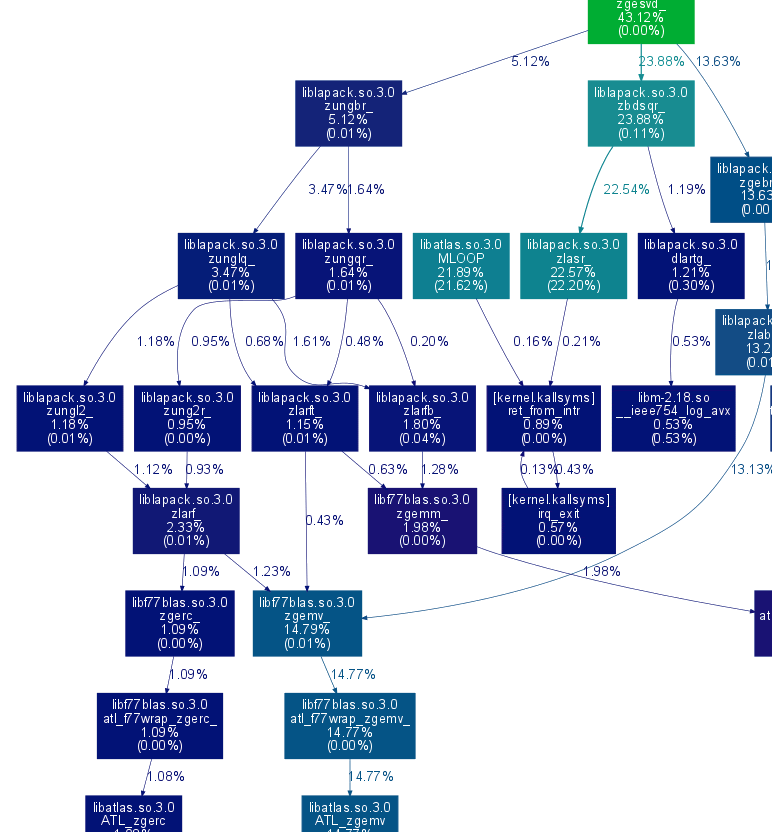
or even better produce a graph
# perf script | gprof2dot.py --format=perf | dot -Tsvg > profile_graph.svg
that you can now visualize
# gnome-open profile_graph.svg
The output should look more or less like this (only a subset of my graph is shown)

