Installing Linux perf on Windows Subsystem for Linux
The Windows Subsystem for Linux is a useful component of Windows that allows you to run a variety of Linux distributions in a virtual machine, with near perfect integration with your Windows machine. In other words, the Linux system can access your files, it can launch Windows commands, and it can coexist with other Windows applications, such as Emacs or programming tools.
I find myself often developing using both Linux and Windows tools, checking that the libraries we build, such as our tensor network tools, can run on both operating systems. But there's one thing that Linux can do better and that is profiling.
On Linux there is a tool called perf, which is rather obscure and unknown, but which excels at discovering the performance bottlenecks in your code. This tool works by running your programs and monitoring what they do. In particular, it periodically "interrupts" the code, checking which function it is currently in. This allows perf to implement a statistical profiling of your code, even if it was not compiled with profiling in mind. This is particularly relevant, for instance, when testing the performance of a C or C++ or Cython extension built for Python, where pyinstrument can only offer you information about the Python code, and not about what is happening at the machine level.
Unfortunately, perf does not come with the WSL2 Linux distributions, because these distributions use customized kernels without support for linux-tools (at least not out of the box). Fortunately, you can build and install this tool yourself. The steps are as follows:
Download and unpack the source code. I am using the following mirror that right now has a 6.9.0 version, but any version will do.
wget https://mirrors.edge.kernel.org/pub/linux/kernel/tools/perf/v6.9.0/perf-6.9.0.tar.gz
tar xzf perf-6.9.0.tar.gz
Install all the development tools that this code requires. They are quite a lot, but you can remove some of them afterwards. I am using Debian package names and
apt-get, which is the package management tool for this Linux.sudo apt-get install build-essential flex bison libssl-dev libelf-dev elfutils libdwarf-dev libdw-dev libslang2-dev libcap-dev libzstd-dev libunwind-dev python3-setuptools numactl libbabeltrace-dev libpfm4-dev systemtap-sdt-dev libnuma-dev libtraceevent-dev libperl-dev libbfd-dev pkg-config
- Build and install
cd perf-6.9.0/tools/perf
make
sudo make prefix=/usr/local install
That's it. Now you can profile your code with something like
perf record python example.py
and explore the output
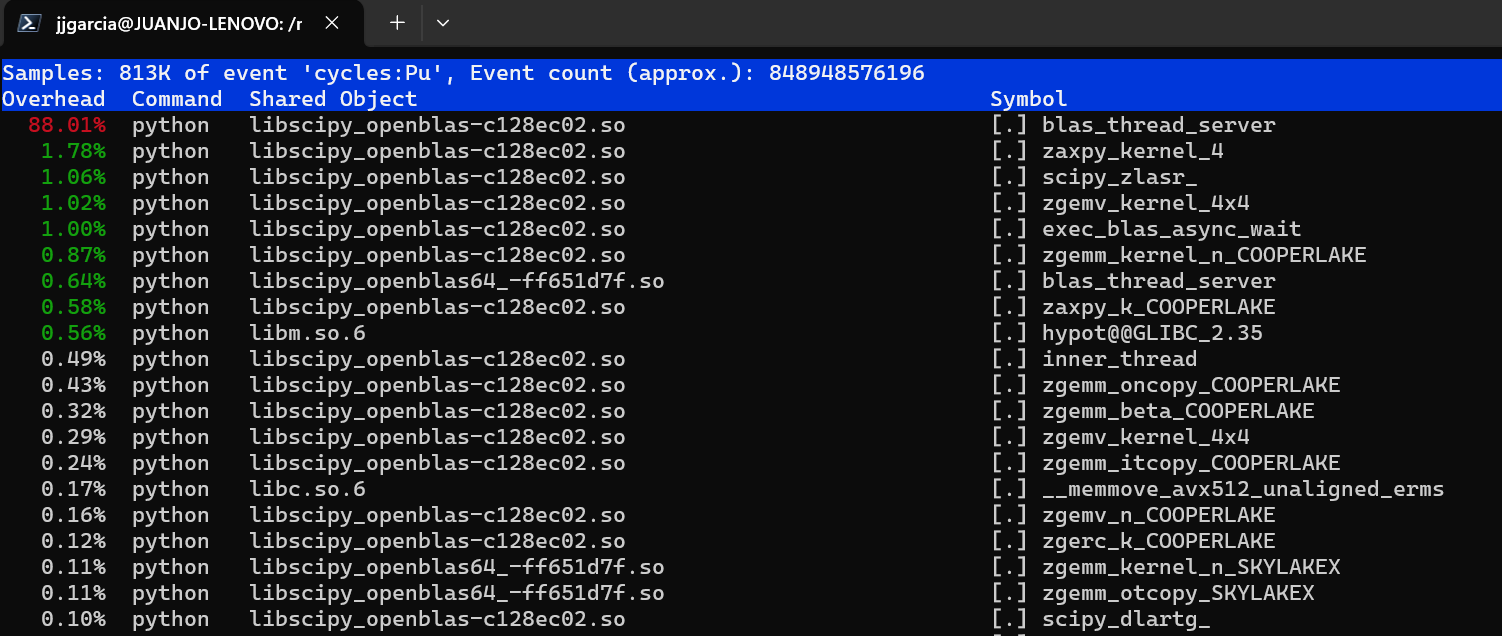
perf report --demangle
obtaining something that, in the worst case, looks like this

